
We move through economic cycles much like we do the seasons. Like preparing for changes in temperature by carrying an umbrella in case of a forecast storm, so too can investors consider approaches to help manage the elements of the economic cycle.
Every year, December brings the heat of summer, which gives way to autumn and then winter. Seasons are inevitable. Change is constant.
The economic cycle also follows a similar pattern. Like there are four seasons, there are four stages of the economic cycle. The four stages of the economic cycle however do not last for a set three months, and they seem to be getting more extreme.
The four identifiable stages that make up the economic cycle are expansion, slowdown, contraction and recovery.
Chart 1: The economic cycle
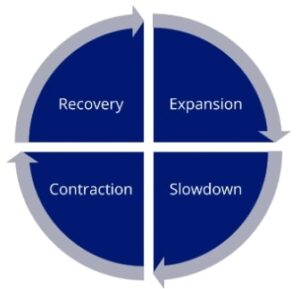
The seasons of the economic cycle vary in length and in magnitude. Change and unpredictability is a feature of markets.
The challenge for investors is finding the investment, or investments, for the season. It would be naïve to think that a strategy could weather all seasons, but we think there is a way to provide shelter from the extreme elements.
Two indicators identify each stage of the economic cycle:
- The direction of the economy (expanding or contracting); and
- The change in pace of economic activity (getting faster or getting slower).
Therefore:
- In an expansionary environment, the economy is growing (expanding) at a faster rate;
- A slowdown occurs when economic activity slows down (still growing, but at a slower rate) after an expansion;
- In a contraction, the economic growth is negative (contracting) and activity is still falling; and
- A recovery occurs when economic growth, after the trough of a contraction, starts to head toward growth.
To visualise this, we use the PMI (Purchasing Managers’ Index), which is an index used to measure the prevailing direction of economic trends in the manufacturing and service sectors. It measures the change in production levels across the economy from month-to-month so is considered a key indicator of the state of the economy. The chart below shows the three-month rolling PMI changes since the start of this century, highlighting the stage of the economic cycle at that time, signified by different colour dots.
Chart 2: ISM Manufacturing PMI Index
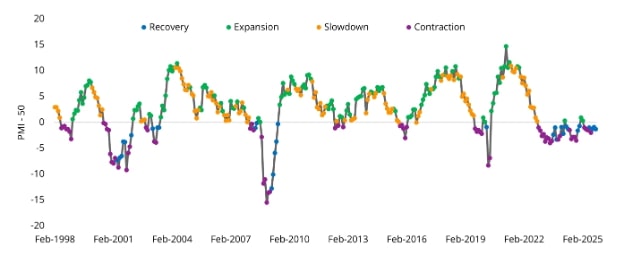
You can see that expansions, recoveries, slowdowns and contractions all vary in length. The peaks and troughs are also inconsistent. Like forecasting the weather, it’s a challenge to predict the economy.
Investors must consider the rises and falls of the economy and navigate these to achieve their targeted outcome. We have spoken before about factor investing. Factors are any characteristic that helps explain the long-term risk and return performance of an asset. According to MSCI “Factors are well documented in academic research and have been used extensively in portfolio risk models and in quantitative investment strategies. Active fund managers use these characteristics in their security selection and portfolio construction process.”
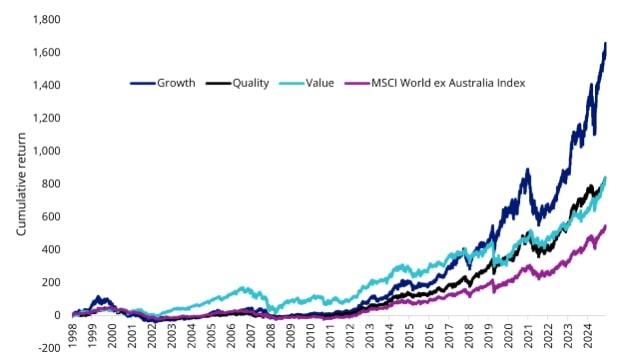
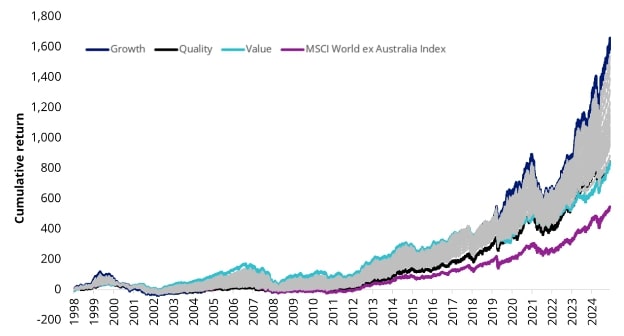
MSCI calculates ‘factor’ indices, which aim to capture the risk and return of factors. According to MSCI, “Over time, individual factors have delivered outperformance relative to the market.”1You can see this in the chart below, which shows the returns of international equities, as represented by the MSCI World ex Australia Index, and MSCI’s factor-based quality, growth and value indices. The data goes back to 1998, the same as the PMI chart above. You can see that, at different times, different factors did well. From 2002 to 2006, value did well, more recently, since the COVID shutdowns, growth has been the go-to-factor.
Chart 3: Hypothetical performance of MSCI Factor Indices and the MSCI World ex Australia Index
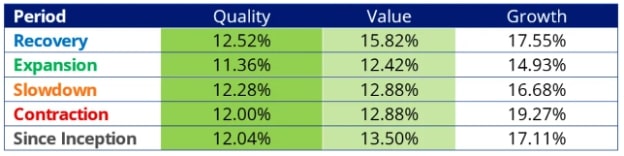
Factors perform differently in different economic regimes. The table below considers the past performance returns of MSCI’s equity style factor indices during the different economic ‘seasons’ noted in the PMI chart (chart 2).
Table 1: Total performance (% per annum) during different economic regimes
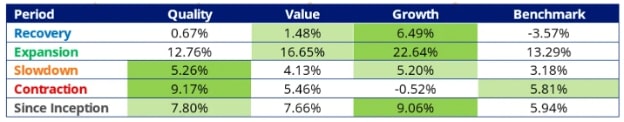
You can see that the growth factor has historically been the best performing since 1998. It was the best performing factor during past recoveries and expansions. It had a negative return during previous contractions. This is when the quality factor came to the fore. The quality factor also achieved its best performance during prior slowdowns.
The table above highlights that it would be naïve to think that a single strategy could weather all seasons. From year-to-year, no single factor dominates. Since 1998, Growth has been the best performer in 11 of the past 25 calendar years. Quality and Value had the best performance in seven calendar years.
While Growth had the strongest overall return, it is also the riskiest, in terms of the size of historical loss (from a previous high, or ‘drawdown’), and the volatility of past returns (as measured by standard deviation of returns).
‘Drawdown’ is a measure of the depth of a fall from a historical peak. You can also observe the pace of the recovery to a new peak. Investments that fall less and recover faster are more desirable. The maximum drawdown of growth since 1998 was 71.31%, way back in the dotcom bust. Quality, on the other hand has the best drawdown over the past 27 years, its maximum drawdown was only around 48%, also during the dotcom bust. Quality also recovered about eight months quicker than Growth at that time.
Another way investors consider risks is the standard deviation of returns. In simple terms, the more volatile the returns, the higher the standard deviation, which theoretically translates to higher risk.
You can see in the table below, Growth has the highest volatility of returns, in all seasons. Quality has the lowest.
Table 2: Standard deviation of returns (%) during different economic regimes
Perhaps blending factors could help navigate markets. A combination of quality, growth and value may help investors achieve outperformance, while managing the risks.
In the chart below the grey lines represent 46 different hypothetical portfolios using different combinations of the past returns of two or three of the factors. Each portfolio, it is assumed, rebalanced annually back to its original composition.
Chart 4: Hypothetical performance of international equity models
You can see each of these portfolios outperformed the MSCI World ex Australia Index since 1998. There is a way to assess whether the blend(s) reduced the volatility of a single factor while maximising the return. The Sharpe ratio, which considers the returns and the volatility, is used to ascertain the risk-adjusted returns. Of the 50 return series assessed above (46 hypothetical models and the four indices), a portfolio with 40% Quality, 30% Growth and 30% Value had the highest Sharpe ratio over the period assessed2.
It is challenging for investors to navigate economic conditions and prevailing markets. ETFs that capture the factors outlined are being used by savvy investors as tools, to either hold through the cycle, or blend together or with active managers, to help mitigate the troughs of the cycle.
ETFs are ideal building blocks for an investment portfolio because they offer liquid, diversified and cost-effective exposure to many different asset classes and markets via simple trades on ASX.
We have dedicated pages for quality investing, value investing and growth investing:
Quality Investing: An investment approach focused on quality companies
The pages include videos and flyers. They also highlight other investment approaches that capture the quality, growth and value factors.
As always, we recommend you speak to an investment professional to determine which investment/blend is right for you.
Sources:
1Introducing MSCI Factor Indexes
2November 1998 to October 2025 using monthly calculations. Risk free rate used was RBA cash rate. Past performance is not a reliable indicator of future performance. Not a recommendation to act.
Any views expressed are opinions of the author at the time of writing and is not a recommendation to act.
VanEck Investments Limited (ACN 146 596 116 AFSL 416755) (‘VanEck’) is the issuer and responsible entity of all VanEck exchange trades funds (Funds) listed on the ASX. This is general advice only and does not take into account any person’s financial objectives, situation or needs. The product disclosure statement (PDS) and the target market determination (TMD) for all Funds are available at vaneck.com.au. You should consider whether or not an investment in any Fund is appropriate for you. Investments in a Fund involve risks associated with financial markets. These risks vary depending on a Fund’s investment objective. Refer to the applicable PDS and TMD for more details on risks. Investment returns and capital are not guaranteed.
GWTH, VLUE and QUAL are indexed to a MSCI index. GWTH, VLUE and QUAL are not sponsored, endorsed or promoted by MSCI, and MSCI bears no liability with respect to GWTH, VLUE, QUAL or the indices. The PDS contains a more detailed description of the limited relationship MSCI has with VanEck and the funds.


